
In college coding classes, transforming step-by-step ideas into clear diagrams is a vital skill. Moving from text-like plans to drawn maps takes practice and attention to detail. While pseudocode mimics programming with words, flowcharts use shapes and arrows to show how data really moves. This guide explores both styles, their differences, and how to transition between them without confusion.
Read Also : https://ahadtech.in/code-to-flowchart-converter/
Comparison of Features
| Feature | Pseudocode | Flowchart |
| Representation | Written steps using plain language and logic. | Visual shapes and directional lines. |
| Problem Solving | Excellent for laying out specific logic and math. | Best for seeing the “big picture” and overall flow. |
| Flexibility | Quick to change; adjustments are straightforward. | Requires more effort to alter; often needs a redraw. |
| Clarity | Stays clear even with dense information. | Can become cluttered or “tangled” if overfilled. |
| Standards | Loose setup; uses terms like IF, ELSE, WHILE. | Fixed layout; follows strict ISO 5807 shapes. |
Understanding the Tools
Before converting, you must understand what each tool represents:
- Pseudocode: A rough sketch of what code might do. It skips the rigid syntax of specific programming languages to focus on logic, making it easier for humans to read.
- Flowchart: A diagram that lays out a method step-by-step. By tracing paths through boxes and diamonds, mistakes in logic or order stand out faster than they do in text.
How the Conversion Works Step-by-Step
Turning pseudocode into a flowchart involves matching every line of logic to a corresponding geometric symbol.
1. Analyze the Logic
Go through the pseudocode piece by piece. Spot the start, the inputs, and the outputs. Identify where values change (math) and where choices happen (logic branches).
2. Match Lines to Shapes
Every instruction fits a specific icon:
- Terminators (Ovals): Used for BEGIN, START, END, or STOP.
- Input/Output (Parallelograms): Used for commands like INPUT password or PRINT “Success”.
- Processes (Rectangles): Used for math, assignments, or data storage, such as
SET length = 0. - Decisions (Diamonds): Used for IF statements or loop conditions. These always have at least two exit paths (Yes/No or True/False).
3. Connect the Flow
Start at the top with a “Start” oval. Link each shape with arrows pointing forward. When a loop (like a WHILE loop) is finished, the arrow should circle back to the decision diamond to check the condition again.
4. Verification
Trace the diagram using test values. If your pseudocode handles factorials, try “0” as an input to see if the flowchart follows the correct path to the end.
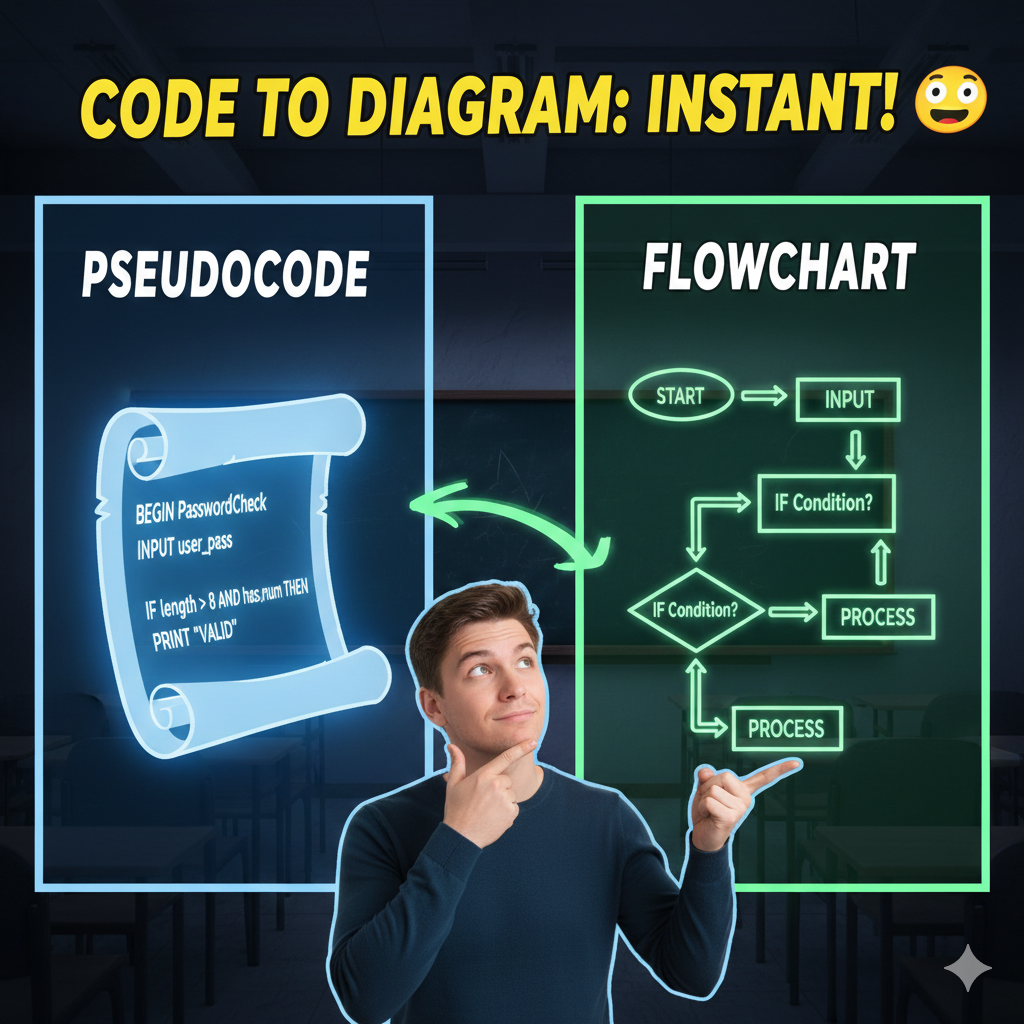
Case Study: Password Validator
This example shows a tool that verifies if a password is at least eight characters long and contains a number.
The Pseudocode:
Plaintext
BEGIN PasswordValidator
  INPUT password
  SET length TO 0
  SET has_number TO False
  WHILE length < password_length
    char = character at position length
    IF char is a digit
      SET has_number TO True
    END IF
    SET length = length + 1
  END WHILE
  IF length >= 8 AND has_number == True
    OUTPUT "Valid Password!"
  ELSE
    OUTPUT "Invalid Password!"
  END IF
END
The Converted Flowchart:
In this visual representation, notice how the WHILE loop creates a physical loop in the diagram, and the IF statements create branching paths.
Best Practices for College Homework
To achieve high scores on your assignments, keep these tips in mind:
- Follow Standard Symbols: Stick to the ISO shapes. Using a rectangle for a decision instead of a diamond is a common mistake that loses marks.
- Maintain Flow: Diagrams should generally read from top to bottom or left to right. Avoid crossing lines; use small circular “connectors” if the map gets too complex.
- Label All Paths: Every line exiting a diamond must be labeled (e.g., “Yes/No”).
- Use Indentation in Pseudocode: Just like real code, indenting your IF and WHILE blocks makes it much easier to see where a flowchart branch should begin and end.
Disclaimer: For informational purposes only.

Ahad Tech is a proper website name which is run by Mohammad Abdul Ahmed and in this website you show proper guide step by step to all exclusive content because i have experience of 13+ years of web development field and proper coder. we strive to turn our passion for Technology, Educational & Information into a thriving website to help people with daily needs.