

Blooket might seem like just another quiz game at first sight—teachers build questions, kids enter a code, then race through bright little challenges. Yet underneath the fun visuals hides a precise system built on numbers and logic, shifting how learners engage with lessons. Peering into this structure matters more than it sounds: without grasping the patterns, teachers miss chances to boost results, while players overlook ways to sharpen their moves. Math shapes every choice, even when nobody realizes it.
This deep dive examines how chance shapes Blooket’s gameplay, with odds quietly guiding outcomes across different modes. One finds decisions tied not just to luck but also to trade-offs between speed and accuracy. Each choice feeds into a larger pattern shaped by hidden probabilities. Behind every quiz round lies a structure built on points, prizes, and uncertainty. The collection of virtual items follows predictable frequency trends rather than pure surprise. These patterns influence attention spans during classroom sessions. Student behavior shifts when rewards appear within reach. Numbers often tell a story deeper than surface play suggests.
Foundational Math in Blooket’s Structure
The Core Gamification Equation
Blooket works because of a basic idea from psychology—backed by math-based reward patterns. Instead of the usual way of teaching, it changes how learning feels: suddenly, practice follows rhythms that feel natural, almost automatic. Rewards appear not all at once, but spaced out, shaping effort without force. This rhythm keeps attention steady, avoiding sudden drops in interest. Learning gains momentum when timing matches behavior, subtly guiding choices. What looks like play actually aligns with deep cognitive habits. Progress becomes visible through small wins, repeated often enough to matter.
Correct Answer → Earns Points
Something much more intricate emerged instead:
Right Choice → Could Lead to Chance Reward with Possible Big Gain or Loss
A change that looks minor at first glance can reshape behavior in deep ways. When rewards appear without a clear pattern, attention grows stronger compared to steady, predictable returns. Unpredictability in timing triggers neural activity linked to motivation, outlasting the effect of standard scoring methods.
Game Mode Stats Spread
Not every Blooket mode works the same way beneath the surface. One might give each result an equal chance, like drawing names from a hat. Another could tilt odds on purpose, making a few results pop up less often. These hidden patterns shape how players experience fairness—or unpredictability—during play.
Math Behind the Search for Gold
A chance-driven twist on quizzes defines Gold Quest, Blooket’s top game type. Knowledge alone isn’t enough—outcomes hinge partly on randomness. This blend creates depth few educational games reach. Success depends less on memorization once probability enters. Each question becomes a small gamble shaped by skill and draw. Fascination grows because results aren’t fully predictable. Math underlies every decision behind the scenes. What seems like play involves layered mechanics underneath.
The Chest Selection Method
Correct answers in Gold Quest lead learners to pick among three chests—a moment shaped more by chance than control. Though similar to the Monty Hall puzzle, it plays out differently. Hidden outcomes depend on fixed odds, not shifts based on what someone picks. The structure guides results through preset likelihoods, making each selection a test of luck, not logic.
The chance of getting items from Gold Quest chests:
| Outcome | Probability | Mathematical Impact |
|---|---|---|
| +10 Gold | 5% | Linear growth |
| +20 Gold | 12.5% | Linear growth |
| +30 Gold | 17.5% | Linear growth |
| +40 Gold | 15% | Linear growth |
| +50 Gold | 13.5% | Linear growth |
| +100 Gold | 7.5% | Linear growth |
| Double Gold | 9% | Exponential growth |
| Triple Gold | 4% | Exponential growth |
| -25% Gold | 3% | Proportional penalty |
| -50% Gold | 1% | Proportional penalty |
| Steal 10% | 4% | Redistributive |
| Steal 25% | 4% | Redistributive |
| Swap Gold | 2% | Redistributive |
| Nothing | 2% | No effect |
Total: 100%
Expected Value Calculations
A student holding 100 gold sees the value of a right answer emerge when each result’s chance adjusts for how much it changes their coins.
Positive outcomes:
(0.05 × 10) + (0.125 × 20) + (0.175 × 30) + (0.15 × 40) + (0.135 × 50) + (0.075 × 100) = 28.75 gold
Multiplicative outcomes (using 100 gold baseline):
- 0.09 × 100 = 9 gold average
- 0.04 × 200 = 8 gold average
- 0.03 × (-25) = -0.75 gold average
- 0.01 × (-50) = -0.5 gold average
Assuming average enemy gold value of 100:
- 0.04 × 10 = 0.4 gold average
- 0.04 × 25 = 1 gold average
Total expected value per correct answer:
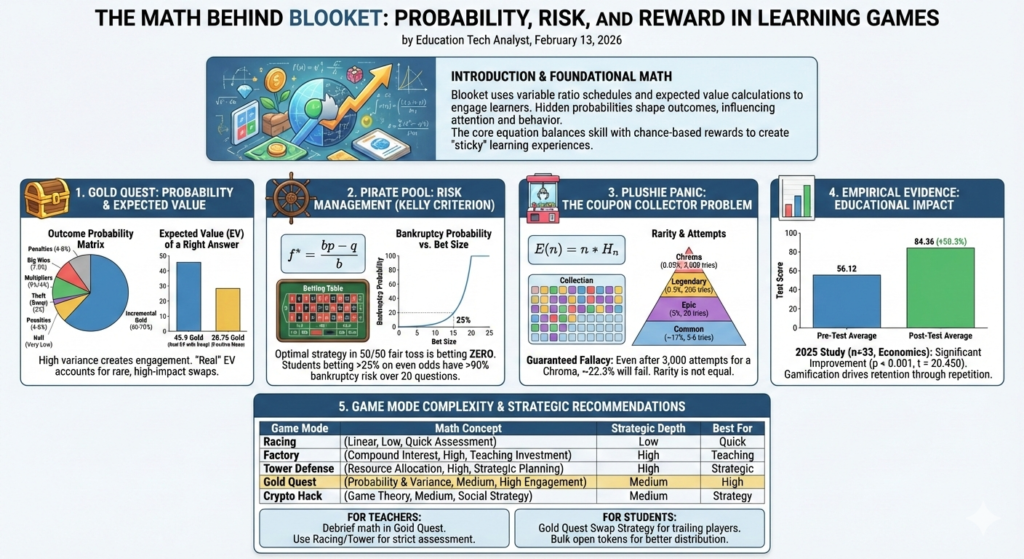
28.75 + 9 + 8 – 0.75 – 0.5 + 0.4 + 1 = 45.9 gold
A single correct response adds to a student’s total in small steps. Still, luck plays a role each round, so outcomes might seem uneven even when averages favor success over many attempts.
The Math Behind Playing Catch-Up
Winning chances for trailing players in Gold Quest arise through its steal-and-swap system. Because outcomes rely on right answers as well as chance, late recoveries become possible. A Markov chain model captures how likely it is for someone far behind to take the lead. Each move shifts position based on fixed odds tied to performance and randomness. Engagement stays strong since elimination isn’t certain until near the end. Even low-ranked participants retain realistic paths forward.
Pirate Pool Risk-Reward Math
Picking paths in Pirate Pool means facing choices where gains come with clear dangers, pushing learners to weigh odds using probability—most do not notice they are working through mathematical ideas. Outcomes depend on guesses about what might happen next, yet each move ties back to figuring averages over time. Risk shapes every turn, while rewards reveal patterns found in chance-based thinking. Decisions unfold quietly within a framework built on expectation, even if the word “math” never appears.
The Betting Decision Framework
Every time a student answers correctly, they choose how many coins to risk based on chance. That choice turns into an expected value scenario—one where outcome and odds shape the decision.
Expected Value = Chance × Outcome Size
A single flip of chance, equal on both sides, defines the game. If success comes, twice the stake returns. Failure means surrendering what was risked.
Betting half the time wins, yet losing during the other half cancels gains. Outcomes balance when chances split evenly. A wager made under these conditions leads nowhere. Zero emerges as the result every round played.
A single coin toss offers no advantage to either side. Still, what matters most isn’t the outcome on paper—instead, it’s how uncertainty feels while waiting. The mind reacts even when numbers stay flat. Risk stirs something logic can’t measure. Learning happens in that tension.
Optimal Betting Strategies
Mathematically speaking, smart bets in Pirate Pool align with a rule called the Kelly Criterion—devised in 1956 by John Kelly at Bell Labs. This approach calculates how much of your bankroll to risk when you hold an edge; instead of going all-in, it suggests a specific portion based on potential gain and loss. Because outcomes aren’t guaranteed, sizing matters just as much as picking winners. When chances tilt your way, the method weighs both probability and payoff. Rather than chasing big wins, it favors steady growth over time. Since losing reduces available funds, the formula adjusts bet size accordingly. That balance helps avoid ruin while still profiting from favorable situations. Overbetting risks collapse, under-betting slows progress—this splits the difference. Though rooted in theory, its logic applies clearly to games like Pirate Pool.
f = (bp – q) / b
Where:
- f = fraction to bet
- b = payout odds offered
- p = probability of winning
- q = probability of losing (1-p)
A single toss of a fair coin—where heads pays 1-to-1 and chance sits at fifty percent—sets the base case. Here, reward matches likelihood, nothing more. Equal payout, equal probability: balance defines the setup. The edge vanishes when gain and risk align perfectly. Outcomes stay split, predictable in their randomness:
f = (1 × 0.5 – 0.5) / 1 = 0
This implies zero wagering stands as the best mathematical choice—consistent with how ongoing even-odds wagers often end in loss, simply because outcomes fluctuate unpredictably.
Learning Risk Assessment by Doing
Not everyone sees how Pirate Pool makes math tangible—until a student risks five hundred coins, then watches them vanish. Losing hits harder than winning feels sweet, which mirrors what psychologists observe about human behavior. Such moments stick because emotion shapes memory more sharply than repetition ever does. Understanding deepens when numbers carry weight, not just on paper but in practice.
Plushie Panic and the Odds of Collecting
A single pull in Plushie Panic feels unpredictable, much like drawing a card from a sealed pack without knowing what lies beneath. Each attempt follows its own odds, shaped by underlying patterns that repeat across tries. Chance stacks differently when outcomes are uncertain every time. Success might come fast—or take many rounds—governed by how likelihood spreads out over repeated trials. These sequences reflect a specific kind of statistical behavior seen in games relying on luck-based rewards.
Rarity Levels and How Often They Appear
Plushie Panic features multiple rarity tiers with exponentially decreasing probabilities:
| Rarity | Probability | Expected Attempts |
|---|---|---|
| Common | Very High | 1-2 |
| Rare | Medium | 3-5 |
| Epic | Low | 10-20 |
| Legendary | Very Low | 50-100 |
| Chroma | Extremely Low | 200-500+ |
Most participants gather frequent and rare pieces swiftly under this system, yet finishing sets remains unlikely for many. A few progress further while others stall early. Progress slows at higher levels due to shrinking odds. Completion proves elusive even with prolonged effort. Luck shapes outcomes more than time invested.
The Coupon Collector Problem
A single plushie added at random makes full completion tricky—this mirrors an old math challenge about coupons. When every one of n unique toys appears equally often, the average tries needed grows alongside the count. Getting that last figure takes longer than most expect, simply because luck controls each draw. This pattern holds steady no matter how many are pulled before it. Completion time stretches further with each new type included.
E = n × Hn
Hn stands for the nth harmonic number, roughly equal to ln(n) + γ—this value being about 0.57721.
A collection of twenty stuffed toys, each equally likely to be picked:
E ≈ 20 × (ln 20 + γ) ≈ 20 × (2.9957 + 0.57721) ≈ 20 × 3.57291 ≈ 71.46 tries
Even so, uneven odds—like those in Plushie Panic—make calculations trickier. What drags out collection time most? It’s snagging that one ultra-rare piece. Take a legendary plushie dropping once every two hundred tries: clearing the set might take many hundreds of rounds. Some could be pulling for well past a thousand.
The Trading Economy
When odds differ, systems often spark exchange. Those holding extra uncommon pieces meet others missing them. Trading happens where mismatched collections connect. Learning comes by doing, not telling—value shifts based on what few hold. Surpluses and shortages shape choices without instruction.
Read Also : https://ahadtech.in/blooket-calculator-tools-how-to-use-guide/
Math Behind Getting Blooks
What stands out in Blooket, math-wise, is how players get Blooks. Instead of choosing directly, they use tokens—gained by playing—to buy packs. Inside these packs: avatars appear at random, sorted by rarity levels. Much like trading cards or digital loot crates, the odds shape what shows up. Probability drives the whole process behind the scenes.
Differentiating Drop Chances from Real Odds
Some Blooket players think a 0.5% drop chance ensures the rare item will appear by attempt 200. Yet this belief mixes up odds over time with certainty in real tries.
One way to solve this is by applying the complement principle in math:
P(success within n tries) = 1 – P(failure across all tries)
Drop rate = 0.5% = 0.005
P(failure per try) = 0.995
P(success within n tries) = 1 – (0.995)^n
This leads to entirely different outcomes compared to simply dividing 100% by the drop rate:
| Attempts | Common Belief | Actual Probability |
|---|---|---|
| 100 | “Should have it by now” | 39.4% |
| 200 | “Guaranteed” | 63.4% |
| 500 | “Definitely have it” | 91.8% |
| 1000 | “This is impossible” | 99.3% |
| 2000 | “I quit” | 99.995% |
Even after 2000 tries—far beyond the simple prediction—a 0.005% chance of still failing exists. That is how random events work: certainty does not exist, only likelihoods remain.
Read Also : https://ahadtech.in/blooket-vs-gimkit-which-game-has-better-rewards/
The Math Behind Opening in Bulk
Starting with a pile of saved tokens, gamers open multiple packs together, tapping into how averages stabilize over time. Though luck decides each draw, patterns emerge when tries add up—rare Blooks show up more predictably across bulk openings. Their actual count still varies, shaped by chance in every session. With enough pulls, results tend to reflect the real odds hiding beneath randomness.
A 1% probability per draw means that after one hundred attempts:
- Expected rares: 1
- Standard deviation: √(100 × 0.01 × 0.99) ≈ 0.995
- 95% confidence interval: 0–3 rare items
This suggests that pulling no rare cards across 100 packs—something occurring roughly 36.6% of the time—is still well inside expected outcomes.
Expected Token Cost
When aiming to figure out how many tokens it might take to get a certain rare Blook, things get trickier. That’s due to the option of trading duplicate copies back into tokens. So instead of straightforward math, one faces a looped calculation pattern.
The Spooky Box as an example:
- Cost: 25 tokens
- Sellback values by rarity:
- Common (74%): 5 tokens
- Rare (20.3%): 20 tokens
- Epic (5%): 75 tokens
- Legendary (0.65%): 200 tokens
- Chroma (0.05%): No sellback
Each pack’s estimated resale amount:
- (0.74 × 5) = 3.7 tokens
- (0.203 × 20) = 4.06 tokens
- (0.05 × 75) = 3.75 tokens
- (0.0065 × 200) = 1.3 tokens
Total expected sellback: ≈ 12.81 tokens
Net cost per pack: 25 – 12.81 = 12.19 tokens
To reach a 99.3% likelihood of obtaining the Haunted Pumpkin Chroma—roughly 1000 tries—the average expense would be:
1000 × 12.19 = 12,190 tokens
Theories on How the Algorithm Really Works
Though Blooket shows drop rates openly, the exact method behind how Blooks are handed out remains undisclosed. Various ideas have emerged among players.
Theory One: Fixed Global Counter
This idea proposes that Blooket tracks how many packs are opened worldwide using a shared count. Once that number hits 100 for a 1% drop rate, the following pack reveals the rare item. That tally zeroes out every day. So someone might land the rare right away—landing on the exact global hundredth opener—while another person pulls endlessly and finds nothing.
Theory Two: Personal Independent Probability
This traditional view suggests every pack draw stands alone, governed by fixed odds. Though it mirrors common mechanics in digital loot systems, and proves easier to build into games, such a model fails to account for stretches where players report unusually good—or poor—luck.
Theory Three: Timed Refresh Windows
Occasionally, Blooket might release rare items only within tight time frames. When the day’s limit hits zero, drops pause completely—waiting becomes necessary until refresh. Success with pack openings often ties directly to these hidden cycles. Timing plays a role few notice right away.
Getting clear on the exact algorithm means seeing Blooket’s internal code—or studying vast numbers of card pulls. Both options sit out of public reach.
Game Mode Math Compared
Besides shaping how students interact, various Blooket game modes rely on distinct math frameworks. While one mode might build on probability, another leans into sequential patterns. Because of these differences, the way learners respond can shift noticeably. Rather than follow a single approach, each format adjusts pacing and challenge type. As a result, attention levels and comprehension may rise or fall depending on structure. Even small design changes affect how players solve problems during gameplay.
Racing Mode: Steady Advancement
A single right response pushes the learner ahead by a set amount—racing relies on basic arithmetic. Progress follows directly from performance; every step ties clearly to an answer given. Because results depend strictly on input, evaluation happens fast. Yet predictability tends to dull interest over time, reducing replay appeal.
Read Also : https://ahadtech.in/the-token-mirage-how-saving-tokens-rarely-gets-you-a-mythic-blook-in-blooket/
Tower Defense: Balancing Resources
Spending wisely matters when defenses depend on right answers. One choice might mean more towers now, another could bring stronger upgrades later. Some go wide with cheap options, others wait for power. Each move trades speed for strength, numbers for impact. Decisions shape how long the base survives.
Factory Mode: Exponential Growth
What begins small grows faster when nurtured early—Factory Mode uses rising gains to show how patience shapes outcomes. Choices made at the start multiply later, revealing lessons about waiting and reinvesting through quiet momentum rather than sudden leaps.
Crypto Hack: Game Theory Dynamics
One move affects everyone else’s choices. Choosing to attack another player might lead to being targeted next. Standing back could mean staying safe—or losing ground. Each decision ties directly to what others do. The setup mirrors classic standoff scenarios where trust breaks down easily.
Mathematical Complexity Across Game Modes
| Game Mode | Primary Math Concept | Randomness Level | Strategic Depth | Best For |
|---|---|---|---|---|
| Gold Quest | Probability distributions | High | Medium | Engagement unpredictability |
| Pirate Pool | Risk-reward balance | Moderate | High | Decision-making |
| Plushie Panic | Coupon collector problem | High | Low | Rarity motivation |
| Racing | Linear progression | None | Low | Quick assessment |
| Tower Defense | Resource management | Low | High | Strategic planning |
| Factory Mode | Compound growth | Low | Medium | Economics concepts |
| Crypto Hack | Game theory | Medium | High | Social strategy |
| Tower of Doom | Character stats + chance | Moderate | Medium | Roleplay interaction |
Educational Impact—Does Math Matter?
What stands out in Blooket is its layered math design—yet the real test lies in how well students actually learn because of it.
Empirical Evidence
A recent investigation at a public high school in Tuban explored how Blooket influenced student performance in economics. Thirty-three learners in grade ten took part during 2025. Findings showed notable shifts in test scores after using the tool. Though small in scale, the work highlights potential gains through interactive formats.
- Average pretest score: 56.12
- Average posttest score: 84.36
- Average gain: 28.24 points (50.3% increase)
- Statistical significance: p < 0.001, t = 20.450
The researchers concluded that “Blooket as a learning medium has an influence on student learning outcomes” and noted that the platform is “proven capable of creating a more interactive, fun learning atmosphere, as well as motivating student involvement in economics lessons.”
The Way Math Helps Learning
Mathematical components within Blooket support education through multiple pathways:
Increased Practice Time
Engagement stretches further when rewards appear unpredictably. A learner who normally skipped assignments spent eight consecutive evenings on Plushie Panic, drawn by the urge to complete a set.
Incidental Learning
Midway through a round, learners pick up math ideas simply by playing. A teacher once noted, “During an English quiz game, I found myself working out odds without realizing it.”
Metacognitive Development
After playing games, talking about what happened pushes students to explain how they made choices. Thinking about their own thinking builds stronger brain connections over time—shaping smarter decisions later on.
Emotional Engagement with Concepts
When victory lifts mood or defeat brings disappointment, memories form more deeply. A student who once risked all on a poor gamble tends to recall that moment clearly—not just the loss, but also the lesson about odds. That experience sticks better than facts heard during an ordinary class discussion covering identical material.
Limitations and Concerns
Some teachers question whether Blooket’s math-heavy design actually helps learning. Typical doubts involve:
Overemphasis on Luck
Sometimes chance plays a bigger role than skill, making effort seem pointless. Correct answers might still lead nowhere if luck interferes. Top performers often react badly when randomness undermines their results. Outcomes shaped by unpredictability can weaken motivation over time. Success that depends on fortune rather than preparation feels hollow.
Distraction from Content
When math games take center stage, learning sometimes fades into the background. Focusing on how to win bets could mean less attention lands on historical details meant for review.
Gambling Mechanics Concerns
Worries appear among teachers about how loot boxes might mirror gambling habits. What keeps students clicking on Blooket—unpredictable prizes, almost-winning moments, finishing sets—isn’t so different from tactics found in slot machines or free-to-play apps pushing real-money buys. Hidden patterns pull attention quietly, without shouting their purpose. Feelings of progress get tangled with chance, blurring lines between learning tools and profit-driven games. Design choices shape behavior more than most notice at first glance.
Emotional Distress
Fear of numbers hits hard when grades swing unpredictably. Some learners come close to tears, educators say, following steep losses from poorly judged guesses.
Strategic Suggestions Using Math Analysis
Understanding the mathematics behind Blooket enables more effective use of the platform.
For Teachers: Research-Supported Methods
Choose Game Type Based on Learning Goals
| If You Want To Teach… | Choose… |
|---|---|
| Fact recall | Racing or Gold Quest |
| Risk assessment | Pirate Pool |
| Probability | Plushie Panic |
| Economics | Factory Mode |
| Strategic thinking | Tower Defense |
Debrief with Purpose
Learning math takes place during moments of thinking back, not merely while playing. Following every round, pose questions:
- “What was your strategy? Why?”
- “Was that mathematically optimal?”
- “What would you do differently next time?”
- “How did probability affect the outcome?”
Set Time Limits That Make Sense
Different game modes require different time investments:
- Racing: 5–10 minutes
- Gold Quest: 10–15 minutes
- Pirate Pool: 15–20 minutes
- Plushie Panic: Best played over multiple sessions
Know Your Audience
Avoid high-variance games with students who:
- Get emotionally attached to points
- Struggle with loss and disappointment
- Are extremely competitive
Teach Probability Clearly
Start by setting aside five minutes to go over what happens when randomness shows up in gameplay:
- What drop rates actually mean
- Why random doesn’t mean balanced right away
- How expected value works
- Why nothing is ever guaranteed
For Students: Math-Based Approaches
Gold Quest Strategy
- Correct answers speed things up—extra tries bring additional chances
- When tough moments happen, remember they’re part of the process
- Persistence brings results because the outlook remains favorable
- Those finishing near the bottom gain most from changes late in the game
Pirate Pool Strategy
- Calculate expected value before betting
- Small, consistent bets outperform occasional “all-in” bets
- Set a loss limit and stick to it
- Remember: losing 100 hurts more than gaining 100 feels good
Plushie Panic Strategy
- Understand that “guaranteed after X attempts” is a myth
- Opening many at once becomes cheaper when you save up first
- Sell duplicates to fund more attempts
- Trade to complete sets rather than relying solely on packs
Future of Math Games in School Learning
Blooket represents a broader trend in educational technology: the application of sophisticated mathematical models from game design to learning environments.
Emerging Trends
Personalized Difficulty Algorithms
Later updates could include smart systems that change quiz hardness depending on how learners do, much like enemies in digital games shift challenge levels.
Skill-Based Matchmaking
Faster learners might face peers at comparable skill levels through multiplayer setups, keeping matches stimulating across the board. Pairing pupils by performance helps sustain interest during gameplay. Challenges stay balanced when systems group users with close proficiency. Engagement rises if opponents feel evenly matched. Similar capabilities support fairer interactions in digital environments.
Learning Analytics
Tracking choices during problem-solving might reveal how learners think about their own thinking, going beyond right or wrong responses. Insight emerges when reports highlight patterns in decisions, not only outcomes. A closer look at strategy use can expose shifts in reasoning over time. What matters is not simply accuracy, but the path taken. Observing these moves offers a window into deeper learning processes.
Ethical Design Considerations
When learning apps grow sharper at holding attention, creators face tougher choices about right and wrong. Does clever design inspire—or quietly push too far?
Conclusion
Far beneath the surface, Blooket runs on complex math few players notice. Behind Gold Quest chests lie intricate probability patterns shaping outcomes. Pirate Pool wagers rely on hidden expected value logic guiding results. Plushie Panic follows a model where collecting items mirrors real-world accumulation odds. Each time a Blook appears, chance operates through precise binomial frameworks. Design choices favor neither luck nor skill alone—they balance both to sustain attention while delivering lessons.
This advanced math approach cuts both ways. When applied thoughtfully, extra practice emerges naturally, hidden chances to learn appear, while awareness of thinking grows. Misapplied, irritation follows, attention drifts from subject matter, troubling links to game-like rewards surface instead.
What matters most is purposeful application. When teachers grasp the math shaping each game format, they choose fitting versions aligned with goals, ready learners for unpredictable results, yet guide discussions afterward—this is where insight takes root. Learners aware of underlying numbers build smarter approaches while staying calm even when luck shifts unexpectedly against them.
Blooket shows what’s coming—learning shaped by chance, powered by play. With every question answered, outcomes twist like game mechanics, turning reviews into unpredictable moments. One correct response might unlock a rare reward; another could reset progress entirely. Where math meets motivation, classrooms shift without fanfare. Lessons gain rhythm through surprise rather than repetition. Instead of waiting for grades, students watch spin wheels after quizzes. Knowledge builds not in silence but amid bursts of sound and color. Behind each choice lies code calculating odds, adjusting difficulty, keeping engagement steady. Education moves forward—not by lecture alone—but through clever design that feels light, even when it’s deep.
This future might lean toward hope or hardship—its direction shaped less by machines, more by human decisions. What matters isn’t the tool, but the intention behind its use. Outcomes emerge not from circuits, rather from choices made day after day. The path taken rests not in invention, instead in responsibility carried forward.
Disclaimer: For informational purposes only

Ahad Tech is a proper website name which is run by Mohammad Abdul Ahmed and in this website you show proper guide step by step to all exclusive content because i have experience of 13+ years of web development field and proper coder. we strive to turn our passion for Technology, Educational & Information into a thriving website to help people with daily needs.